SNOW WEATHER – The Season’s Snow Blocking Highs
High pressure systems play havoc with the winter. Image:: Perisher
Snow Blocking Highs | The Grasshopper
Snow drought
We probably say this about every winter, but it’s been a weird one. After two big storms – one in late June and the other early July – we had more snow on the ground than any season since 1990, but by the first week of September we all seemed to be staring at each other and wondering what might have been.
A bit of snow in the last few days has given us confidence that we’ll make it through to the end of the season at the major resorts. But what the heck was the deal with that warm, snow eating weather in late July and most of August? And how warm was it?
The average maximum temperature at Thredbo Village in August was 8.9 degrees, compared with a long term average of 6.6 degrees. The average minimum was -1.8, compared with a long term average -2.5. This places August as warmer than about 75 per cent of previous years. Rainfall was 135 millimetres compared to an average of 187mm and to make matters worse, most of it arrived when it was too warm for any snow. The snow depth at Spencer’s Creek in the Snowy Mountains lost about 30 centimetres from about July 20 to September 1.
Super-heavyweights
During this period, we talked a lot about the high pressure systems that were getting in our way. The general theme for several weeks was that promising cold fronts from the Southern Ocean would beat themselves to death on large, almost stationary high pressure systems and then limp through the resorts with barely a whimper.
When highs were centred more in the northern Tasman Sea and across northern Australia, we had a scenario of the cold fronts simply missing their target altogether by sliding away ineffectively to the south. Figures 1 to 3 below show one example of this. It was frustrating, but at least it ensured fairly fine weather.
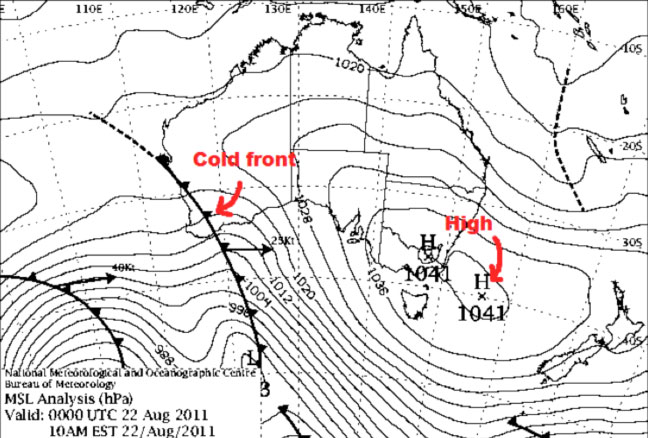
Figure 1: August 22
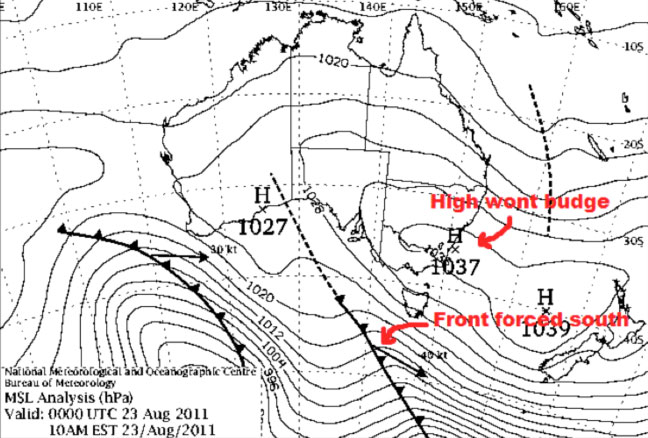
Figure 2: August 23
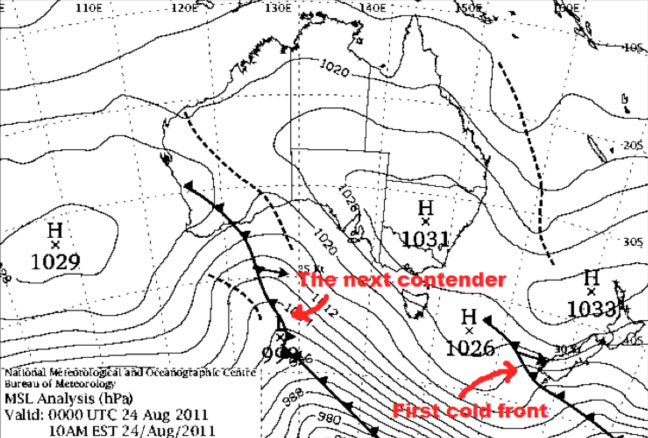
Figure 3: August 24
Rubbing salt in the snow.
As if the situations above weren’t bad enough, we had three very similar examples when a high was centred south or south-east of the mainland that went something like this:
Rather than sweeping over the Aussie Alps with all of its cold fury, the cold front would stutter somewhere in the Bight as in Figure 4.
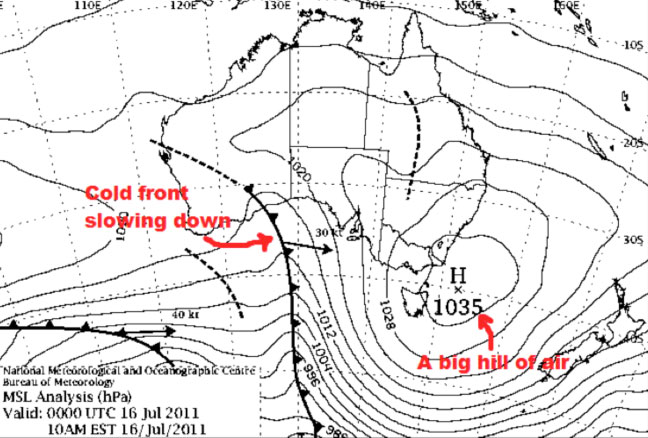
Figure 4: July 16
Then a low pressure system would form on a northern section of this cold front as in Figure 5.
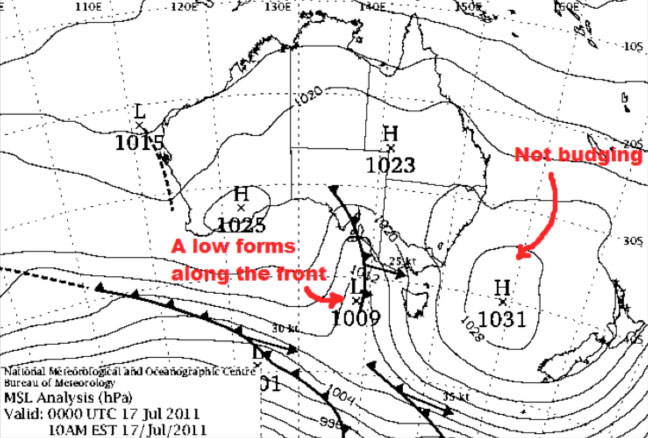
Figure 5: July 17
That low would slowly migrate eastward, all the while bringing down warm, moist air from the north, with some falling as rain over the Alps, as in Figure 6.
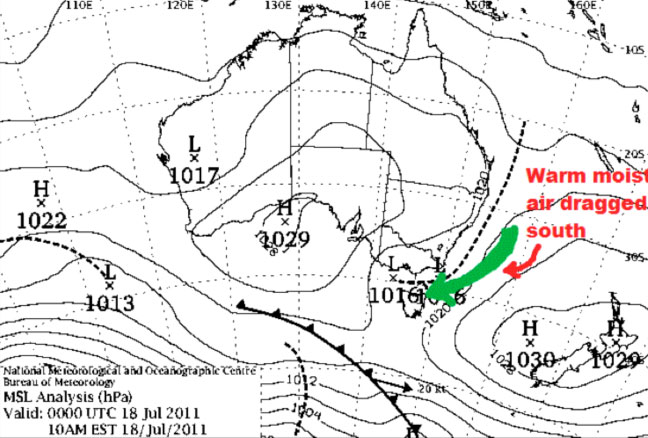
Figure 6: July 18
When the low finally made it east of the resorts, it would bring in a south-easterly. So much warm air had already been sucked down south by the low that the south-easterly brought in more rain, not to mention wind hold, as in Figures 7 and 8.
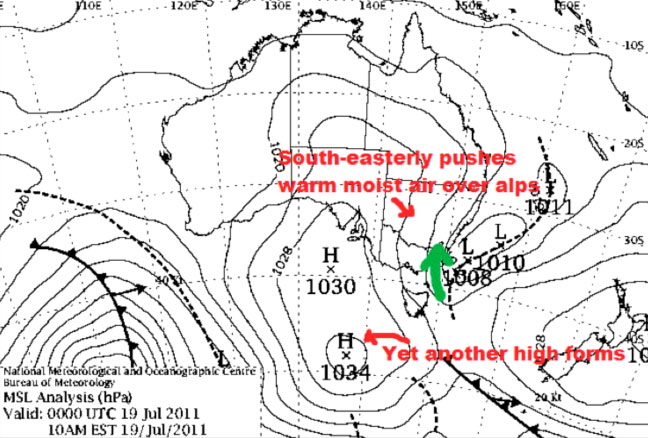
Figure 7: July 19
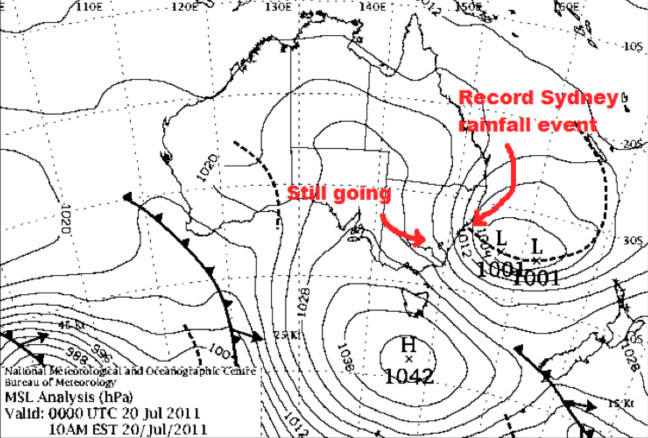
Figure 8: July 20
Swings and roundabouts
There is an important field of study in meteorology that deals with why those highs hung around for so long, keeping the snow-producing weather away from the resorts.
Firstly, when the central pressure of a high is well above average for several days, and doesn’t move very much, then we call it a “blocking high”. If you have been following our forecasts this winter you would have seen me use (and possibly overuse) this term to describe what’s been going on.
When one of these blocking high gets started, the usual westerly jet stream in the middle latitudes is forced to either head further south, or split into two branches, one north and one south. The blocking high discourages the usual west to east progression of weather systems caught up in the flow of the jet stream. It encourages more warm northerly winds on its western edge, and more cold southerly winds on its eastern edge.
So a blocking high is only bad for snow prospects if you’re on the wrong side of it. In mid-August, a blocking high in the southern Tasman was partly responsible for a once in a lifetime snow event to hit New Zealand, delivering several days of ridiculously cold Antarctic air, illustrated in Figure 9 below. A couple of days later the Aussie Alps got a massive northerly rain event.
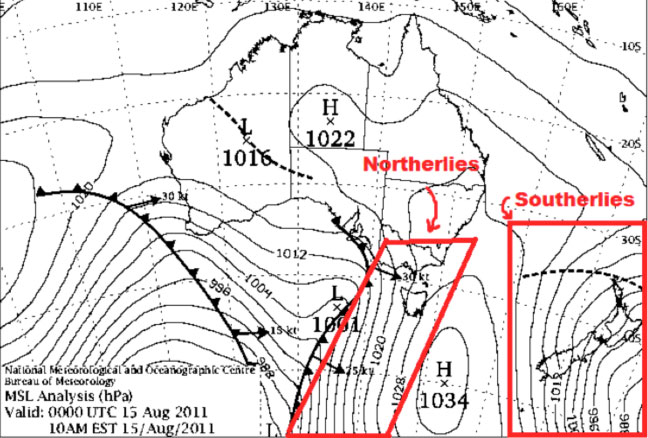
Figure 9: August 15
What scientists know is that blocking highs form when the amplitude of planetary-scale waves in the pressure field gets really big. These planetary waves stretch around the globe and the theory on them is very complicated, but let’s have a crack at understanding their significance to the Aussie Alps. In particular, there are two slow-moving waves that have a big effect in our part of the world.
The first is called wave 1, because as it circles the globe it has one peak, and one trough. The second is called wave 3, because, you guessed it, as it circles the globe it has three peaks and three troughs. You can visualise what I mean about peaks and troughs in the graphic below, with a contour of wave 1 in blue and a contour of wave 3 in red, but don’t take this as anywhere near technically correct. (There are other wave numbers, but they aren’t as important to us at the moment.) As well as visualising the waves in the horizontal try to imagine those red and blue lines rotated 90 degrees into the vertical.
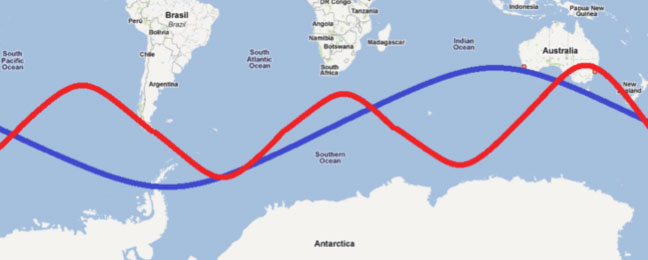
Figure 10: Visual aid for the number of peaks and troughs in planetary waves 1 and 3
Now, if you happen to be under the peak of one of these waves, you’re likely to have higher than normal pressure. Plus these waves move really slowly, so the higher than normal pressure often lasts a long time – potentially giving us a blocking high. And if both wave 1 and wave 3 are peaking in the same place, the peaks literally “add-up”, reinforcing the blocking high.
The patterns of pressure at sea level that we see in weather maps are driven by how the peaks and troughs of all the different planetary wave numbers “add-up”. But it is unusually large amplifications of the slow moving waves 1 and 3 that most often cause blocking highs in our part of the world.
Catch a wave
Unfortunately, the evolution of these planetary waves and blocking highs is notoriously hard to forecast, as they involve the interplay of the atmosphere with the ever changing sea surface temperatures, sea ice, the large mountain ranges of Antarctica, the Andes, and the Southern Alps of New Zealand.
They are also influenced by pulses of energy from the tropics thousands of miles to the north. Essentially, we’re not going to be any better at forecasting “blocking highs” than we are at forecasting the regular pressure field – and we can barely do that more than a week to ten days ahead.
But one thing we know from analysis of many years of weather patterns is that in winter these blocking highs are more common south and south-east of New Zealand than they are south of Australia.
When they are all the way over on the other side of NZ, they aren’t going to have as much influence on the weather systems reaching Australia. But for some reason, and I have no straight-up no idea why, from late July to September we had more than our fair share of blocking highs sitting in the Tasman Sea and south of Australia.
A pretty graph
Figure 11 below is a really effective way to show the presence of blocking highs between the latitudes 45 degrees south and 60 degrees south. It represents places where the height of the 500 hPa level (“about” 5.5km up in the atmosphere) is above or below average in that strip of the globe, averaged out over 5 days. This translates almost directly to increased or decreased surface pressure at those latitudes.
The horizontal axis here is longitude (The oceans south of Australia are between about 113E and 153E). The vertical axis is time, moving forward as you travel down. The blue colours illustrate when the average height/pressure was lower than normal between 45 and 60 degrees south.
The darkest red areas with edges that run nearly parallel to the vertical axis for at least five days are potential blocking highs, as that means we had an area of high pressure that wasn’t moving east or west. I think the areas marked by “2”, “5”, and “7” would meet most meteorologists’ criteria for blocking highs. You could make an argument that area “4” was as well.
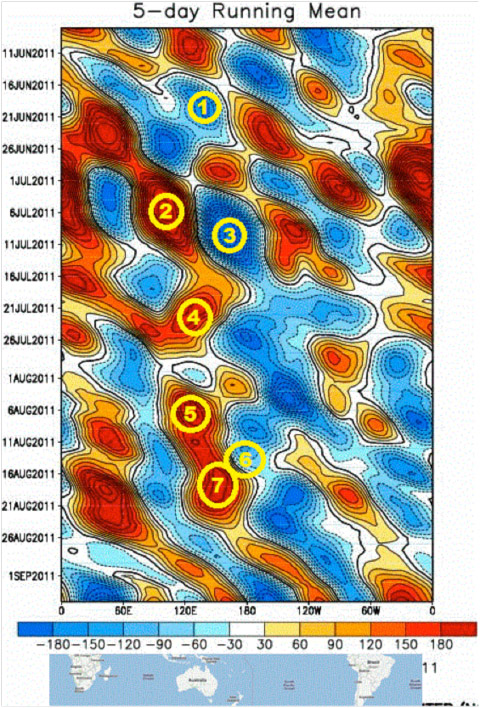
Figure 11: Evolution of areas above and below average 500hPA heights – related almost directly to surface pressure
So we had 3 or 4 of these strong, persistent blocking highs south of Australia when we would usually only expect one or two in a winter. But they didn’t all have the same effect:
“2” was located south-west of Western Australia, but we had lower pressures south of Tasmania, marked by “3”. This set up a massive south-westerly flow over the Aussie Alps and the biggest dump of the season from July 4 to 7. That area of low pressure covered the entire Tasman for several days and also set New Zealand up with its first real goodies of the season.
“4” was located south of Tasmania around July 20 and slowly migrated west, lasting until July 26, and severely weakening two cold fronts before they could reach the Aussie Alps.
“5” got cracking around August 5 and had a double whammy effect. Not only did it stop any cold fronts coming through – it also cradled a low over south-east Australia that brought a lot of rain in a northerly, a little snow in a south-westerly, and then a bunch more rain on a south-easterly.
You could argue that “5” and “7” are basically the same event, but by August 15 the block is now south-east of Tasmania, as we saw in Figure 9 above. This saw once-in-a-lifetime snowfalls for New Zealand (“6”) and another big northerly rain event for the Aussie Alps, followed by a piddling amount of snow.
That just leaves “1”, which was an area of lower than average pressure south of Australia from June 17 to 22 that led to our first big snowfall of the season in June.
If you’ve made it this far: congratulations. You can see at the very bottom of Figure 11 that the high pressures are now south of New Zealand, and the low pressures south of Australia. Judging by the forecast I can’t see any high’s sitting around long enough to become blocks south of Australia in the next 10 days – that’s to be expected as we move into spring and the westerlies become more dominant.
Like I said before, I don’t have a theory on why we seemed to get a couple more blocking highs than normal from mid-July to late August, but I’ve tried to illustrate some of the factors at work. There might be a few professors of meteorology out there who would pull me up on some of the finer points, but hopefully you get the general idea.
That’s all from the Grasshopper. Got a question or feedback for me? Hit me up at grasshoppermw@gmail.com, twitter, or facebook