The Forecast Chart Guide – Understanding the Mountainwatch Forecasts
Mountainwatch | Alex Horvath and the Grasshopper
Every 12 hours Mountainwatch publishes individual forecasts for over 50 ski resorts in Australia, New Zealand, the United States, Canada and Japan. The forecasts come in the form of a table, which contains a daily summary, and a chart, which plots weather variables in 3 to 6 hourly steps to tell you what the weather is going to do in finer detail.
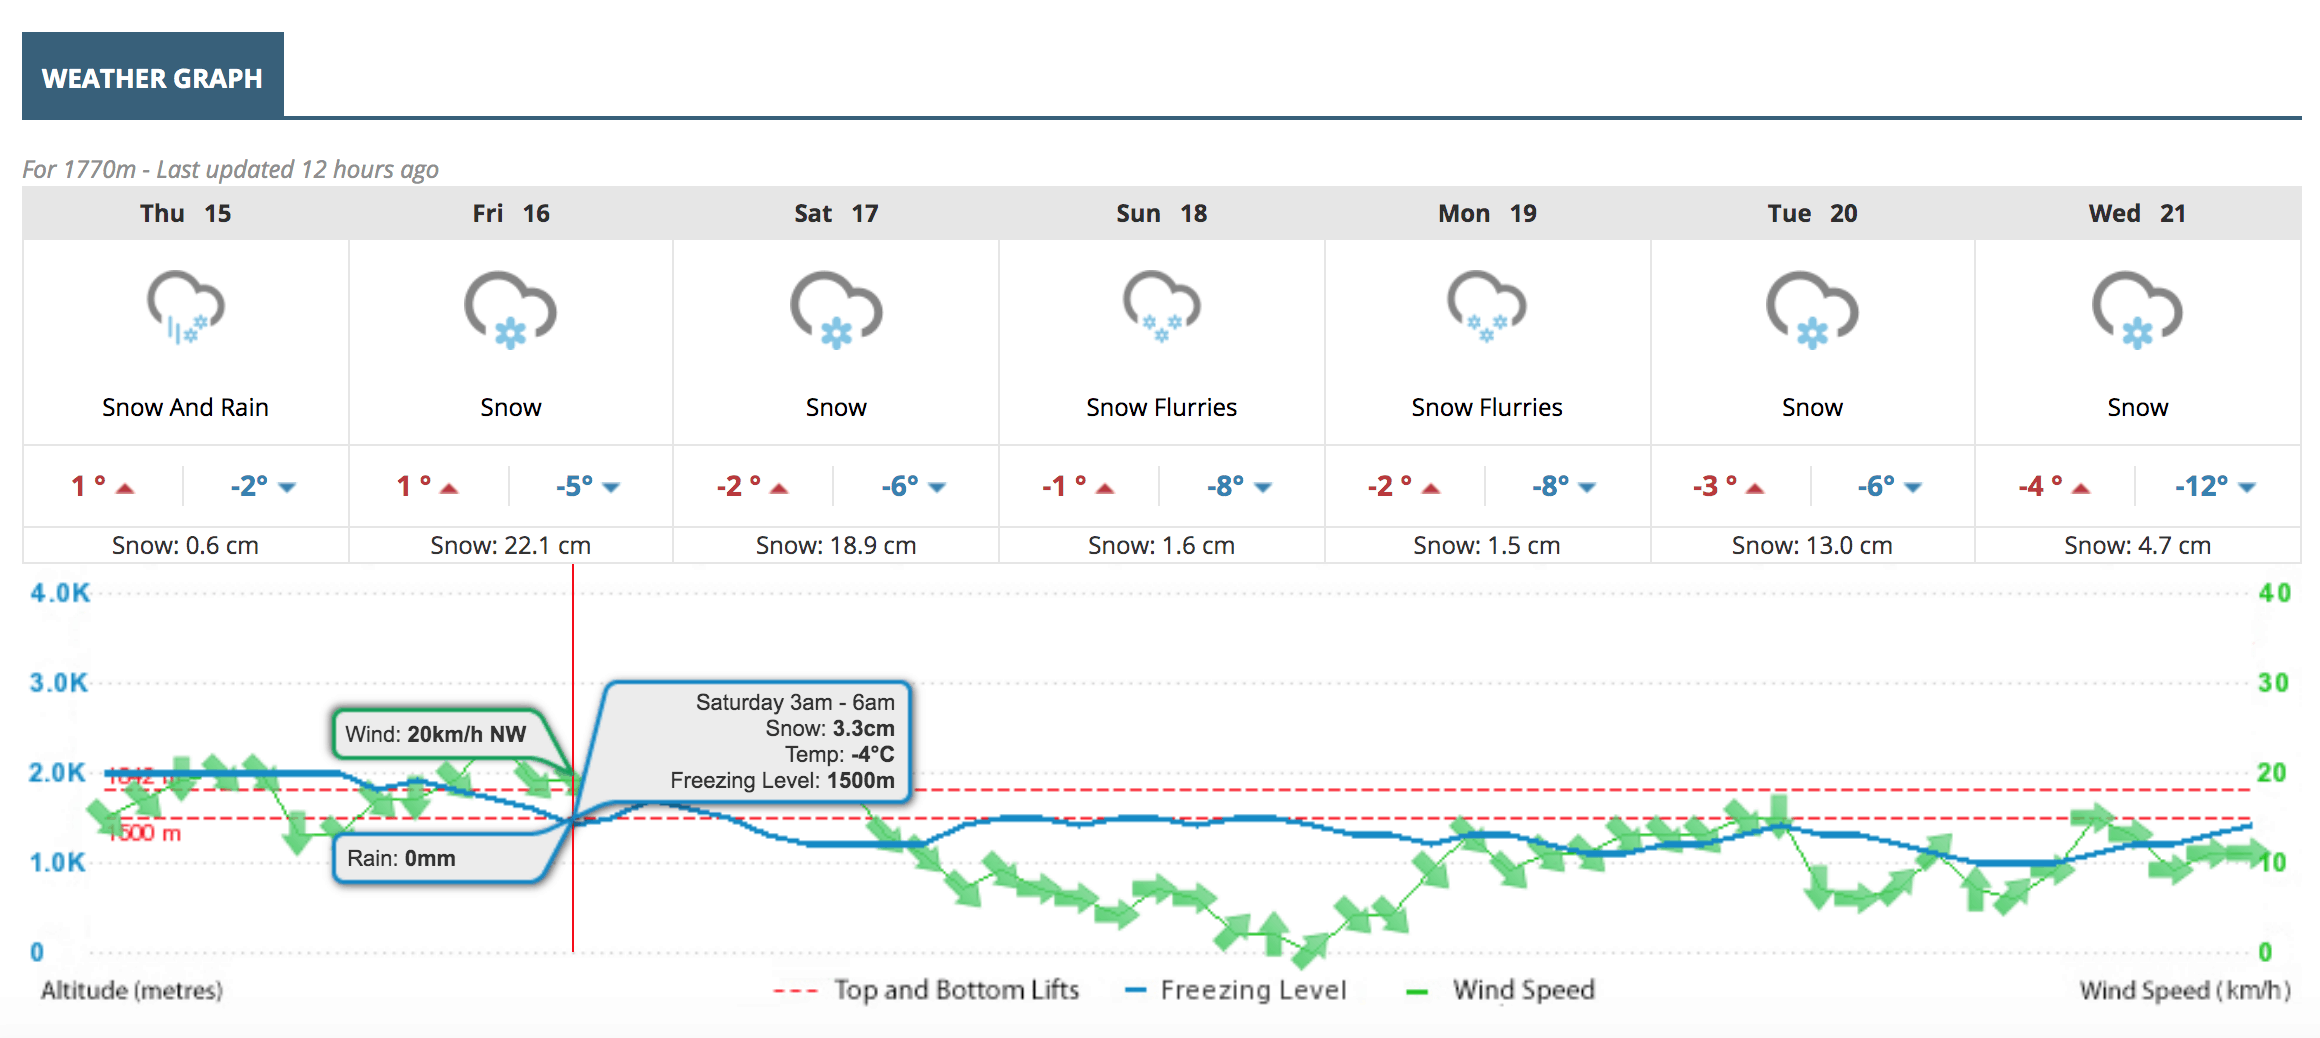
Here’s what we forecast in the table:
Forecast icon: This gives a summary of what the most significant weather will be on the day. The trick here is that if a day is forecast to have a few snow flurries and then become fine, it will be given an icon of snow flurries.
Maximum temperature: This will usually be reached in the afternoon, but can occur any time in the 24-hour period.
Minimum temperature: This will usually be reached around 6am, but can occur any time in the 24-hour period.
Snow: This is the total snowfall in centimetres over the 24 hour period.
Mouse over the chart to see the forecast variables in 3 and 6 hourly time-steps:
Temperature, wind speed and direction: These apply to the end of the time-step.
Snow and rain: The totals in cm and mm for the time step.
Freezing level: This is the height in the atmosphere where the air temperature (away from a thin layer near the earth’s surface) is 0 degrees. When snow falls from a cloud and drops below the freezing level it will start to melt, but if it doesn’t have to go too far it can still settle on the ground as wettish snow. This is really important when the freezing level is just above the slopes as it becomes very difficult to forecast exactly where the snowline will be. We see this at the leading edge of cold fronts, and it can be difficult for the models to get the rain/snow mix exactly right. As a rule of thumb, snow can settle 200 to 400m below the forecast freezing level, depending on how long it’s been snowing.
Origin of the forecasts
The 7-Day forecasts that you see here on Mountainwatch are produced by MetraWeather, an international leader in providing global weather services using a combination of local and global ‘numerical weather prediction’ (NWP) models to produce the forecasts for Mountainwatch.
These NWP models include a local high-resolution model and the output of state of the art global and mesoscale models from the global GFS (Global Forecast System) and ECMWF( European Centre for Medium-Range Weather Forecasts) models, with some algorithms to calculate snow amounts for each ski field area.
NWP models take into account topography so these will capture differences in snow amounts that can occur under various weather patterns interacting with mountain ranges. There is no human intervention in these forecasts to favour one mountain over another
Meso-numerical-computer-what!?
Don’t worry. We hear you. Here is a rough breakdown of how our systems work. Hopefully this will help you to understand a little more about the processes that let us deliver them to you. We use a mix of global and mesoscale numerical weather prediction computer model output to generate the snow forecasts that you see on Mountainwatch.
A global model is one that covers the whole earth (well duh!). A mesoscale model (“meso” just means “middle”) is one that runs only over a selected area, such as south-eastern Australia.
Mesoscale models generally use the output from a global model to get started, and to supply data at the boundary of the model. Because they only run over a small part of the earth, you can afford to run them at finer resolution than global models – essentially getting more bang for your computing buck.
But what’s resolution?
The models work by dividing the earth’s surface into a grid, then slicing the atmosphere horizontally into separate layers. So, you end up with the atmosphere divided into “boxes” and each of these boxes is assigned a temperature, humidity, pressure, and wind speed.
The smaller each of these boxes, the better you can model the effect of cold fronts and other weather systems as they move over complex terrain. And mountains are about as complex as it gets.
Using the horribly complicated “laws of physics” and a lot of even-more-horribly-complicated-quick-kill-me-now non-linear differential calculus, the models work out where everything will be in 3, 6, 9, 12, …, 180 hours time.
We then suck out this model output, apply a bit more tricky mathematics and logic of our own, and turn it into forecasts of snowfall, rainfall, temperature, wind speed and freezing level forecasts for the resorts that matter to you.
So how good are these forecasts?
The models we use forecast for between three and 16 days in advance. Any model starts with a “best guess” of what the atmosphere is doing. Even this initial best guess contains some error. And the maths that the models are doing involves so many calculations that the models themselves have to take a few shortcuts here and there to approximate an answer (otherwise the forecast would take a week to produce and be old before we got it to you).
The further out the models forecast for, the bigger this error grows. For example, the models might forecast the next day’s maximum temperature to within an accuracy of 1 degree on average, but at 7 days this might blow out to more like 3 degrees.
Given that the accuracy degrades over time, here’s a rough guide to interpreting the forecasts:
1 to 2 days ahead: Here you can expect that whatever we’ve forecast will pretty much happen. But remember! There will still be some error. Perhaps the wind speed will be out by 10 per cent, the temperature by a degree or two, and the rainfall and snowfall (two of the hardest things to forecast) could be plus or minus 25 per cent.
3 to 4 days ahead: You can expect that the plot is going to unfold like the forecast says, but the details aren’t going to be perfect. Three days before a cold front hits your favourite resort, it could be 2000 kilometres away, out in the ocean somewhere. Did you know there are not usually more than two dozen weather buoys and a few remote islands taking weather measurements for the oceans south of New Zealand and Australia? You can imagine how this could make it hard to determine the exact amount of moisture that a cold front will have when it reaches the mountains and starts producing snow. Rainfall and snowfall here could be out by 50 per cent either way and we would still call this a good forecast.
5 to 7 days ahead: We need to treat forecasts this far in advance with a little care. What we’re looking for is a general story. Is it going to be fine? Or is it going to be wet or snowing? That cold front might come through a day earlier or later than predicted. The snow totals are only going to be a rough approximation.
It s important to note that highly dynamic weather systems are the most difficult for NWP models to resolve, and that’s why snow totals sometimes vary more than usual with each update. A small temperature change in the modelling can mean the difference between rain and snow, or a shift in the position of the developing low-pressure system can drastically change forecast precipitation totals for certain resorts. This variation between forecast updates is less likely to occur with a run of the mill cold front, whereas a rapidly evolving low-pressure system remains challenging for being certain on snow totals.
That’s about it
When viewing our forecasts, keep in mind that they will update twice per day at around 2:30am and 2:30pm AEST. Remember to drag your mouse over the graphs so you can get an idea of when the snow will fall, what the wind is doing, and where the freezing level is likely to be. A day or two out, this is a great tool to plan your stops throughout the day for beers, lunch or pow, and a week in advance it can help you decide whether to chuck a sickie and score some turns away from the weekend crowds.
You can also check in every morning for a detailed analysis of the weather situation and conditions on the slopes. Our very own forecasting guru the Grasshopper dissects the forecast and gives you a rundown of what to look out for in the week ahead while our daily independent snow reports give you an accurate report on snow and weather conditions each day . Our team of experts know how the weather effects our mountains and add a useful human element to our forecasts.
Perisher forecasts,
snow reports and
live snow cams.
Falls Creek forecasts,
snow reports and
live snow cams.
Mount Buller forecasts,
snow reports and
live snow cams.
Charlotte Pass forecasts,
snow reports and
live snow cams.
Hotham forecasts,
snow reports and
live snow cams.
Thredbo forecasts,
snow reports and
live snow cams.
Mount Baw Baw forecasts,
snow reports and
live snow cams.