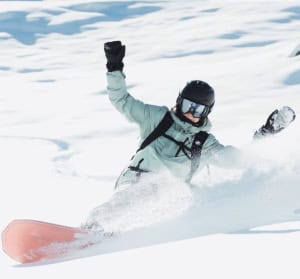
2018 USA Snow Season Outlook – The Grasshopper
Photo: @jacksonhole
Mountainwatch | The Grasshopper
With almost 500 resorts, spread across a 3000 mile wide country it’s hard to talk simply about America’s mountains or conditions.
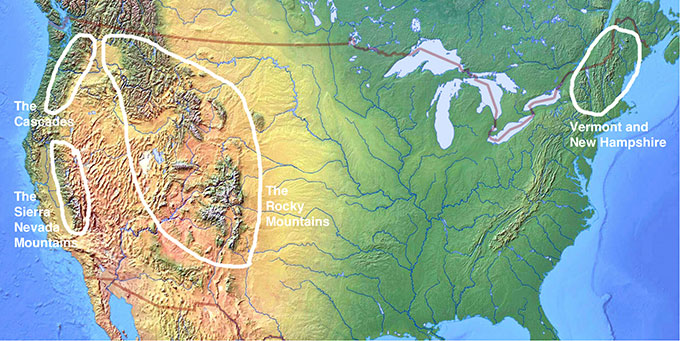
The mountains can be divided into three broad areas. Starting out west in California, the Pacific tectonic plate pushes under the North American plate, and this subduction zone gives rise to the Sierra Nevada mountains and some well known ski areas such as Lake Tahoe and Mammoth Mountain. Following that tectonic plate boundary north we discover the volcanic peaks of the Cascades in Oregon and Washington, then passing through Canada (more on that another day) we arrive at the USA’s northernmost mountains in Alaska.
Also read: 2018 Japanese Snow Season Outlook
Head 1000 miles east from California and you’re about as far as from the ocean as you can be, but the mountains here are still being formed by that Pacific tectonic plate as it slides east underneath North America. Here we find the southern spine of the Rocky Mountains and some of America’s most well known resorts of Vail and Telluride in Colorado. The Rocky’s curve northwest giving us places such as Jackson Hole, Wyoming and Big Sky, Montana, before crossing into Canada.
Head further east again and you reach an area that, although well known for snow, is perhaps less well known for skiing. But Vermont boast three resorts with 20+ lifts – Killington, Okemo and Mount Snow – and numerous smaller resorts.
Snow mechanisms
Now a bit of geeky stuff about the mechanics of why it snows in these mountains. Are you sitting comfortably? It’s time to refresh your physics and latin knowledge. When air reaches a mountain range, it is forced up causing it to cool. Cooler air can’t hold as much water vapour as warmer air, so it condenses and turns into droplets of water or ice hanging in the air… you know these droplets by their common name; ‘clouds’. When the clouds can’t hold the weight of water anymore it starts snowing. The whole process is known as “orographic lift”. Orographic basically means “relating to mountains” in latin.
The quality and quantity of snow received at a particular resort depends on a couple of things. First, how much moisture the air has picked up before it reaches the mountains. The Sierra Nevadas for example are considered a maritime environment, where most snowfall comes from storms which formed over the Pacific Ocean. Whether the storm blows in from the northwest (cooler) or southwest (warmer) affects the quality and quantity of snow the Sierra Nevadas receive. Southwesterly winds are warmer and therefore able to pick up more moisture as they head over the ocean. While this extra moisture means more snow, it is usually wetter and heavier than its northwest cousin which gives primo powder quality – over quantity.
Inland at the Rockies, the climate is more continental, and the air has already travelled a long way over land before it reaches the mountains. The main factor here is the complexity of the mountain terrain. When you zoom in on the Rockies there are a number of distinct ranges, and within these ranges high peaks and deep craggy valleys abound. All these peaks have the effect of getting in the way of each other. For example a storm blowing in from the southwest can bring heavy snow to Silverton, but almost nothing to Aspen 150 miles to the northeast.
The resorts of northeastern USA combine both of these factors, with storms coming down from either the continental northwest bringing smaller amounts of quality powder, or from the maritime northeast bringing large amounts of wetter, heavier snow. The mountains are also spread across a wide area, meaning that during any given storm a resort can take a direct hit and receive heavy snow, or find itself in the shadow of other mountains and miss the party altogether.
All in all it’s tough to be a snow sensei in America.
Seasonal Indicators
There are multiple meteorological indicators that can give us a steer in forecasting conditions weeks or months ahead, and I describe three below. You can think of them like the background conditions for the atmosphere, and knowing them can give you a statistical indication of particular outcomes being more or less likely. It’s a bit like knowing that when the rugby pitch is wet the Wallabies are more likely to beat the Springboks (disclaimer, I don’t actually know the stats on that!). It doesn’t mean that they win every game on a wet pitch, but in the long run if you looked at all the games played on a wet pitch the Wallabies would have won more games.
Problems arise when multiple indicators are pointing in differing or unclear directions making it hard to draw any meaningful conclusions. What is the rugby pitch is wet (Wallabies more likely to win) but they are playing in South Africa (Springboks more likely to win). And now what about if we consider the results of the last three games? And injuries? In many ways, forecasting the weather weeks ahead is a bit like picking rugby results weeks ahead. We can have all the ducks lined up in a row indicating the Wallabies should win a given match, but on the day it just might not go that way.
ENSO
Most of you will be familiar with the El Nino Southern Oscillation (ENSO) as a large scale weather driver that can impact snowfall over a season. ENSO is currently neutral, with about a 50/50 chance for it to stay like that, or develop into a weak La Nina over the northern hemisphere winter.
What does this mean for USA ski areas? Well as you might expect with a neutral state, it’s all looking a bit average. Average snowfalls, average temps, equal chances of more or less snow – blah blah blah – it’s all reading like a lot of hair splitting to me that isn’t helping anyone book a ski trip.
So what else can we look at as we head into winter? There are a couple of useful medium range indicators which can help us pick incoming powder dumps.
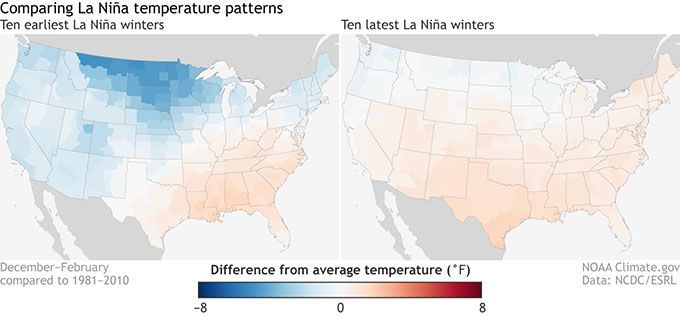
This image shows the difference between the first 10 La Ninas and the last ten La Ninas since 1950. It shows difference from normal temperatures (blue cooler than normal, red warmer than normal), and you can clearly see that while La Ninas may have previously been considered colder than average for the western US, due to climate change we can’t really say that anymore. Image:: NOAA’s climate.gov
Arctic Oscillation
The Arctic Oscillation (AO) is a measure of the stability or volatility of the air sitting over the north pole. This air is usually quite happy just chugging its way around the north pole, but when the Arctic Oscillation index drops very low, this puts up a red flag to meteorological sensei that cold air can easily break free from the north pole and bring heavy snowfall down into more southern US areas, or snow laden northeasterlies into the east coast. We generally get around 10-14 days notice of approaching drops in this index.
The Michael Jackson Oscillation
Just kidding of course. It’s actually it’s called the The Madden-Julien Oscillation (MJO), but I’m sure MJ would have loved to be meteorological phenomenon. The MJO is a major fluctuation in tropical weather which influences precipitation amounts around the world. Sounds bizarre, but the amount of cloud in Singapore right now really does tell us whether it’s more or less likely to snow on Mt Baker next week. We usually talk about “phases” of the MJO, and whether they are strong or weak. It’s a bit like ENSO, but on a 30-60 days cycle instead of months to years.
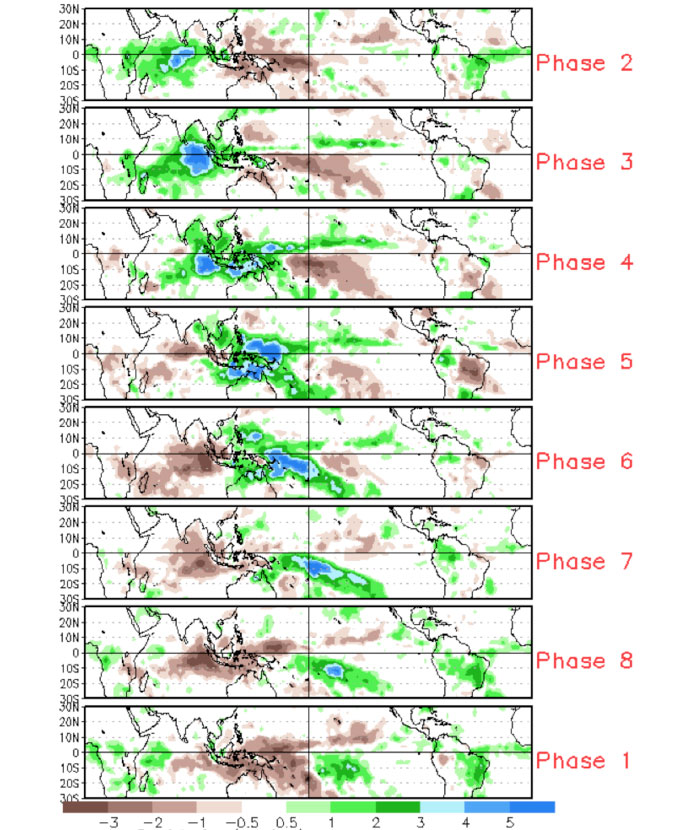
Phases of the MJO. The colours/key corresponds to above (green) or below (brown) average precipitation. Image:: NOAA’s climate.gov
Looking Ahead
Normally speaking, late October would be about the right time to start seeing the first flakes of snow falling at the North American ski fields and thinking about the coming season. But, thanks to climate change, normal isn’t really a word we can use anymore when we talk about the weather.
2017 was a record breaking season in the Sierra Nevadas starting in January with some of the heaviest snowfall ever recorded there, and going right through to a snow storm in June keeping many resorts unseasonably open into July.
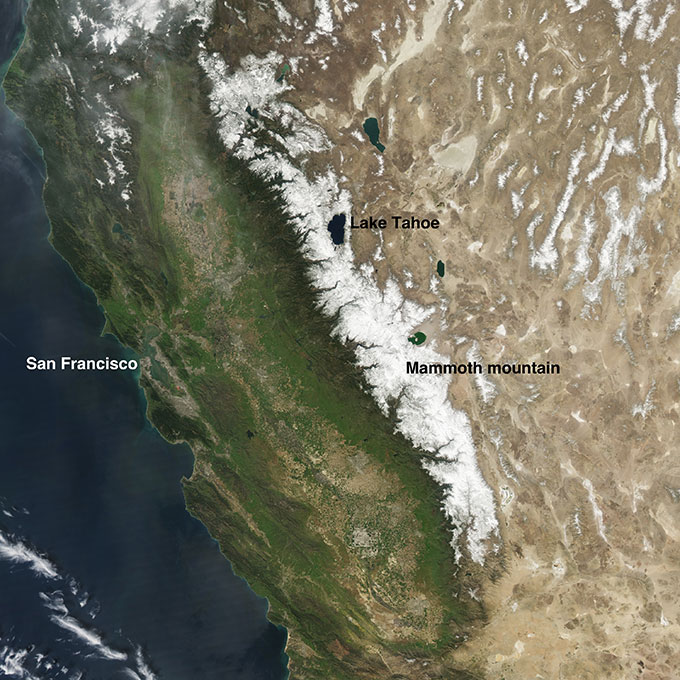
High resolution sat pic from showing snow on the sierra nevadas, and I labelled a few places. Image:: NASA
And now 2018 is also off to an unusual start with the first snowfall of already having occurred on 21 September, the last official day of summer. Does that even count as this season?
ENSO, AO and MJO, along with several other indicators I can pick up on my antennae are not showing anything clear at this stage, either about snowfall in the US this winter, or the results of the next Wallabies vs Springboks game.
Stay tuned.
Heavenly forecasts,
snow reports and
live snow cams.
Vail forecasts,
snow reports and
live snow cams.
Steamboat forecasts,
snow reports and
live snow cams.
Snowbird forecasts,
snow reports and
live snow cams.
Breckenridge forecasts,
snow reports and
live snow cams.
Mammoth forecasts,
snow reports and
live snow cams.