Australia Seasonal Outlook August Update – Snowy July Sets the Groundwork for the Season Ahead
Mountainwatch | The Grasshopper
We have made it to August and things are looking very optimistic, especially compared to my last update. Two consecutive storms in the month of July really helped our cause, boosting snow depths to above a metrein many of the major resorts. I’m going to have a look at what we can expect for the rest of the season and why we had such a nice July.
Christmas in July
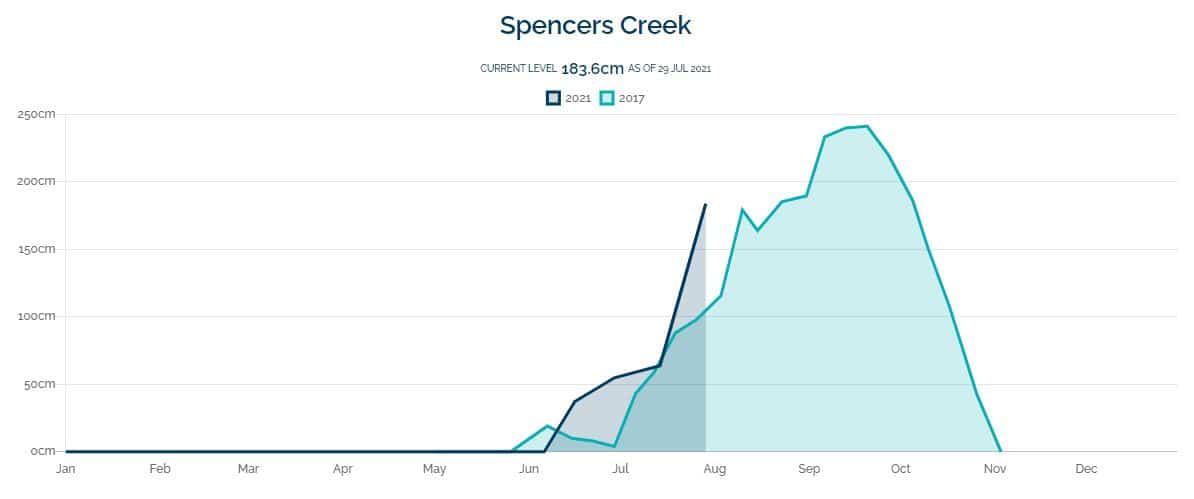
We were teased with two large storms in July after a slow start started to make many people a little nervous about the season ahead. Taking measurements from Spencer’s Creek, we went from a depth of 54.8cm on June 29 to a depth of 183.6cm on July 29. Compare this with a depth of 70.2cm on the same day in 2020, and it is quite a remarkable turnaround and with really only two big storms to thank. Victorian resorts are now back open, and many are flocking to enjoy the conditions which are outstanding for early August and we are now seeing all lifts open in most resorts.
The storms we had in July were different to the storms we had earlier in the season because the SAM (Southern Annular Mode) was largely positive through June, making more traditional stormfronts from the southwest unlikely while also increasing the chance of East Coast low type systems. We saw a few of these systems in June which do bring heavy amounts of precipitation and wild weather but tend to lack the cold temperatures needed to produce snow. July on the other hand, saw a mainly neutral SAM. When the SAM is neutral it doesn’t really influence the climate one way or the other, it more or less allows Australian weather to do its own thing.
This saw the return of those more traditional fronts from the southwest which are usually responsible for the dumps we receive in the Aussie Alps. The stormfronts we received in July were also helped northward by high pressure over Western Australia – contributing to the southwesterly flow. All in all, from June 29 to July 29 to gain 128.8cm in snow depth is a very busy month.
Driver Updates
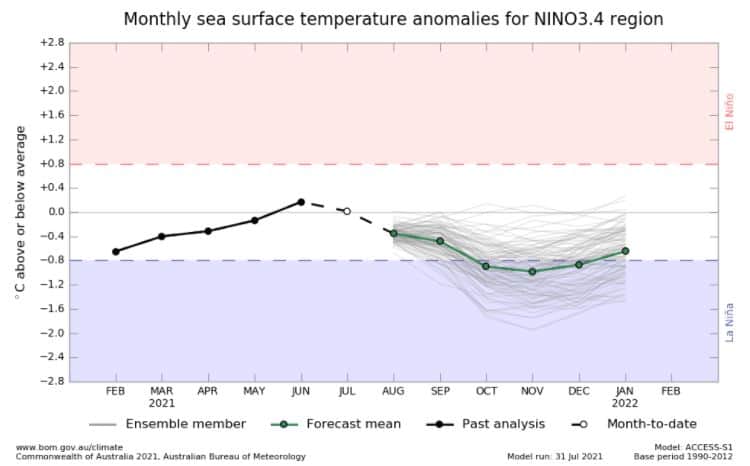
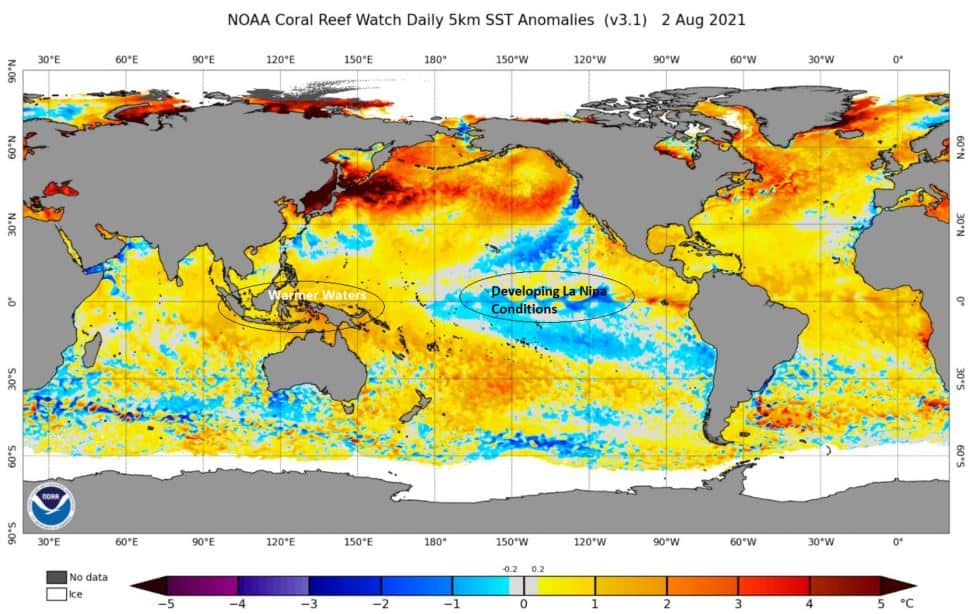
The El Nino Southern Oscillation remains neutral right now with a possible swing into La Nina territory as we close in on the end of the year. Three of the seven models surveyed by the Bureau of Meteorology are forecasting that we will enter the La Nina threshold sometime between now and December and the projection from the Bureau’s own model is pictured below. I’ve spoken about ENSO in all my outlooks, and for La Nina it is good news. Cooler sea surface temperatures in the central Pacific strengthens the “zonal overturning atmospheric circulation” known as the Walker Circulation. Long story short, due to this circulation, the winds associated with it and up and downwelling in the ocean, we see warmer waters congregate around the Maritime Continent/Indo-Pacific region. This warm anomaly generally induces increased rainfall in Australia particularly the east for similar reasons to a negative IOD.
The IOD is negative and has been since a little after my last seasonal outlook. This means warmer waters north of Australia in the tropics which increases available moisture that is often funneled down to southeast Australia through troughs, likely to increase the potency of rain bearing systems and, if the temps are cold enough, generally gives us a better chance of snow in winter.
At the time of writing the Southern Annular Mode is positive and will quickly return to neutral values in several days. I spoke a bit about the SAM earlier and that a neutral SAM has little noticeable effect on Australian conditions. The SAM usually varies on a fortnightly scale and is notoriously hard to predict, so we may still have some periods of negative SAM on the way which is our best chance for snow.
Overall, in terms of the drivers, there is nothing saying our recent run of good luck in the Alps is said to run out but in saying that a little bit more luck is invariably involved for some more big storms.
Temperature and Precipitation
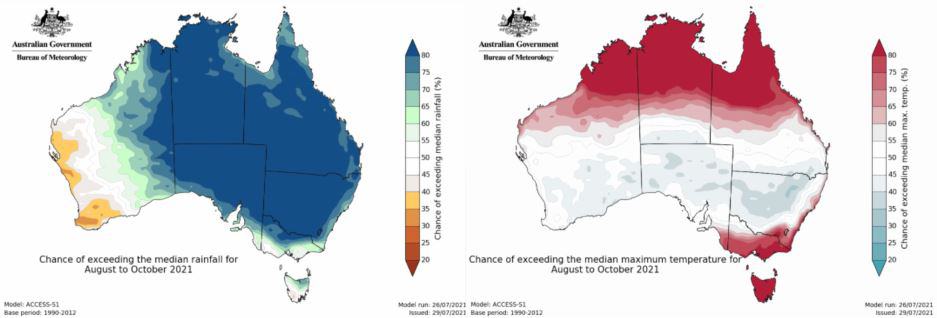
The latest seasonal outlooks by the Bureau show very high chances of increased precipitation for almost three quarters of the country. This is due to the driver situation with the IOD and ENSO both in phases that are conducive to increased amounts of precipitation. The temperature outlook over the southeast isn’t quite as enticing, but this plot has become more optimistic as the season has progressed, for the southeast anyway. Overall, we should see more precipitation than usual and if temperatures can remain cold enough this means we should see more snow.
How Are We Tracking?
In the last update I made a little comparison to 2017 just to show the chaotic nature of predicting snowfall, quite often all it takes is one or two big events and the season’s landscape can be drastically changed.
Here’s a little update on our situation with pictures. Below we have the Spencer’s Creek snow depths for this year vs 2017. Mother nature’s performance in July has us looking quite good, now the challenge is to keep it up.
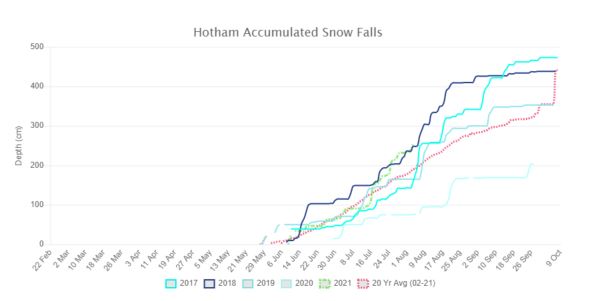
Below we see the accumulated snow falls at Mt Hotham for the last five seasons including this year (2017 onwards) and the average for the last 20 years. We can see very similar profiles between this year and 2017 and, the Mt Hotham visual we can see how we are well ahead of last year right now and up from the 20-year average right now.
So right now, we are looking good, and we have already had some really good conditions. With a little bit of luck, we should be in for the nice snow conditions to continue and there is no need to wait to get up there with many resorts operating all lifts – book a trip if you can.
That’s all from me folks. If you’ve got a different theory on what’s going to happen this winter, or just want to provide feedback, then please hit me up on the discussion below. Or you can follow me on Facebook.