SNOW SEASON OUTLOOK 2014 – New Zealand
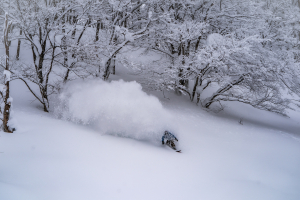
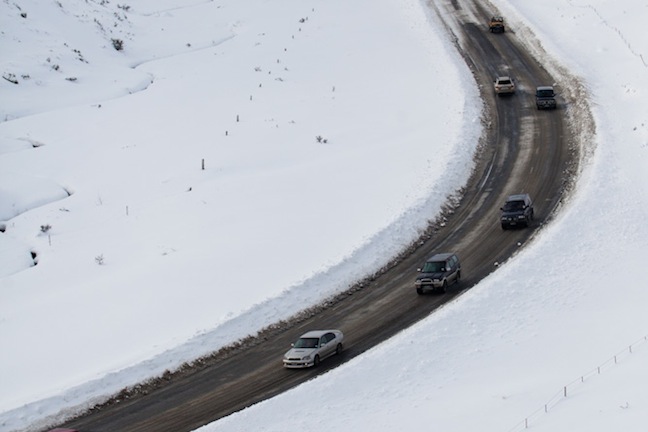
Last season started with a bang, a three metre bang that covered the South Island Image:: Nick Johnson
New Zealand Snow Outlook | The Grasshopperh
I’m stoked to announce that this season we’re enhancing our New Zealand Snow Outlooks. Over the last few seasons we’ve struggled to provide the same level of detail as we do for Australia, simply because it’s really been difficult to get quality snow depth data over a multi-decade period. A few days ago I decided I’d had enough of this, so I’ve gone and made my own dataset. Using observed daily rainfall and temperature info for one central South Island location and one central North Island location, each at about 800m, I’ve been able to estimate seasonal snowfall totals going back to 1972 for roughly a 1500 to 1700m level, and these numbers correlate pretty well with what little observed snow depth data I do have. So strap in for a whole new level of New Zealand Seasonal Snow Analysis.
We’re going to start this outlook in a similar way to my Australian outlook, released last week. If you’ve already read that you can feel free to skim through the next couple of paragraphs, but there’s some stuff I have to repeat because it’s relevant for New Zealand, too.
The first thing you need to know about this season is your climate catchphrase for 2014, and that is “El Nino”. Over the next few months you’re going to continually hear about a strong El Nino event brewing in the Pacific Ocean. And you’re probably going to be told that this situation usually leads to a higher proportion of cooler southerly and south-westerly winds for New Zealand, and it would be fair for you to think: “Well that doesn’t sound too bad for snow prospects.” There are some pretty reliable observations of sea surface temperature coming in right now that suggest an El Nino event is on its way to the Pacific. This is backed up by climate models that have become more and more confident over the last few months that we will be in the midst of a full blown El Nino by August. And it is true that on average El Nino events generally end up with more frequent southerly and south-westerly winds during winter, supplying cooler air which will allow snow to fall to lower levels.
However, there are two very important caveats to all this:
1) We can’t be certain yet that we’re going to get an El Nino.
2) Even if we do get an El Nino event, we can’t be sure that we will get an average or “textbook” response.
Sea surface temperatures are starting to push above average along the equator.
We need to talk about climate models
Specifically, we need to talk about how climate models struggle to see past the April/May period to what’s going to happen on the other side. This is the time of year when temperature variations from west to east across the Pacific Ocean even out, and the eastern Pacific usually returns to a normal state. There’s much less variation at this time of year than at others. This means that the real temperature anomalies across the Pacific are about the same size as the forecast errors of the models one to two months ahead, and so these errors are more liable to overwhelm the real signal and send the climate models off on a tangent. This is close to the worst time of year to trust the models four months out (although they do still have some skill). Be that as it may, there is a confident signal from the models that we’re heading for an El Nino by August, and this is being backed up by observations on the ground (or in the ocean as the case may be).
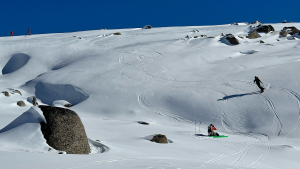
If it does turn out to be an El Nino year, we’ll be hanging for more wrong’uns like this one, Porters Pass roadside, June 24, 2013. Image:: Nick Johnson
So what could go wrong? Well, we were in a similar position back in June 2012, with a very promising El Nino on the way, only to see it crash and burn between September and November. The problem is that at this stage we can’t rule out a repeat failure to launch.
The flaw of averages
The other key issue we have to stare down when forecasting this far in advance, just as for Australia, is the tremendous variation between individual El Ninos. Case in point, we were heading into strong El Ninos during the winters of both 1982 and 1991. But 1991 recorded far more precipitation than 1982 and by my estimates nearly double the snowfall.
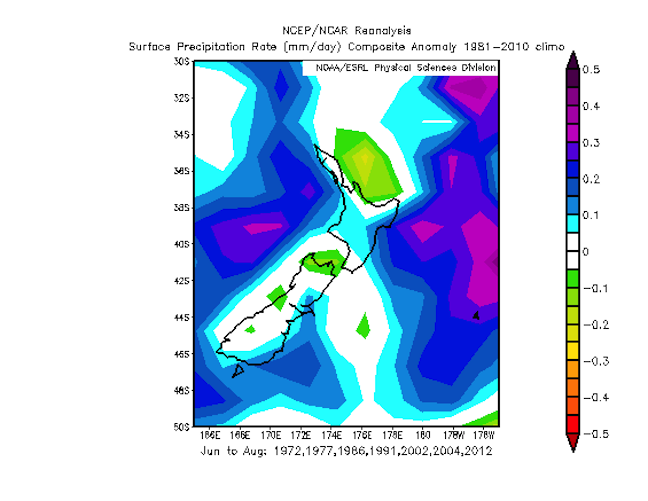
Positive values indicate where 1991 scored higher rainfall.
That’s the funny thing about climate analysis and forecasting: You have to be very careful about how and when you apply averages, and the influence of El Ninos is no exception. A good analogy of this would be trying to forecast how many breasts (or testicles) an unknown adult has, based only on a few vague clues. We know that the average number of breasts (or testicles) across the entire population of both males and females is going to be close to one (give or take a bit for man droughts, medical procedures and moobs). But if you forecast that the unknown adult has exactly one breast (or testicle) you’re highly likely to be wrong. What you need to do instead is look for other clues, that might tip you off as to whether the subject is male or female, to improve your odds of being right.
Climate forecasting faces similar challenges. There’s a lot of detective work, and you often uncover useful relationships in places you weren’t looking for them. So it was that in writing my Australian Seasonal Snow Outlook, I discovered that you can sort El Nino episodes into two distinct groups based on their influence on pressure patterns across Australasia. One of these groups had consistently high snowfalls across the Aussie Alps. The other had consistently poor snowfalls. To forecast snowfall we need to first work out which group the El Nino will belong to.
What the hell has this got to do with New Zealand snow, I hear you ask? Well, those two distinct flavours of El Nino look as though they are equally important for the Shaky Isles. The years with high snowfall across the Aussie Alps appear to have been fruitful in the North and South Islands as well. The crappy years in Oz were just as crappy in NZ.
In the next two charts below, the more classic flavour of El Nino is represented in terms of the average effect is has in raising atmospheric pressures to the west of New Zealand, and lowering them to the east. This is what gives more southerlies, and in the second chart we see this show up as reduced rainfall. My estimates since 1972 suggest that in the South Island this sort of year resulted on average in a 10 to 25 per cent reduction in snowfall, with six out of seven such years recording below average falls. The effect was probably not so bad about the Southern Lakes, but worse the further north you travelled into Canterbury. In the North Island my data suggests about a 7 per cent reduction, although both above and below average results are still possible.
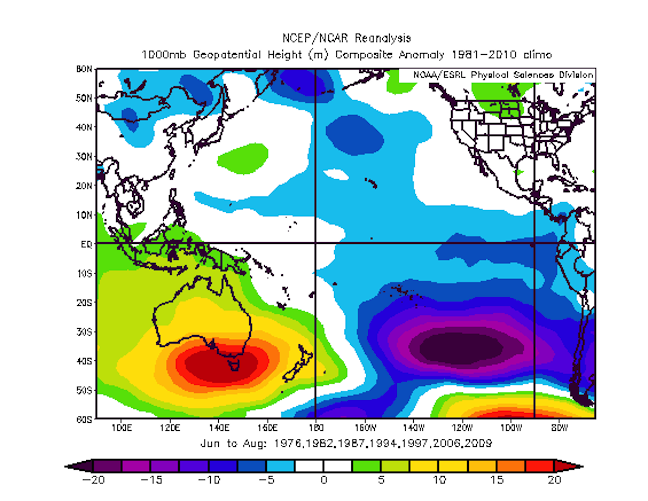
These are the El Ninos your mother warned you about. Areas in yellows and red are where pressure was higher than average, leading to a cooler southerly flow, but inhibiting cloud and rain.
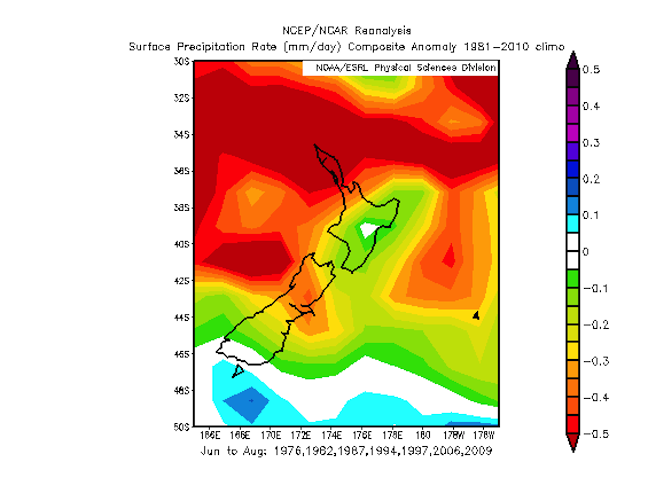
More southerly flow means Southland acts as an umbrella for the rest of the country, leading to below average rain.
In isolation, the charts above present a case to be worried about El Nino, but hold fire for a sec. The next two charts present a different flavour of El Nino, with lower pressures through the Tasman Sea and across NZ. Quite a different scenario, with lows frequently crossing the centre of the country. I’m going to stick with the convention set in my Australian Snow Outlook and call these years “wrong’uns”, because they really do spin the other way.
In the South Island these wrong’un El Nino years have seen a greater proportion of cool south-easterly winds, and roughly average rainfall. My analysis says that’s been enough to increase snow totals on average by 10 to 25 per cent along the central part of the Alps, with five out of seven such wrong’un El Nino years since 1972 coming in above average.
For the North Island the lows crossing to the south means more westerly and south-westerly winds, which is great for increasing rain, and we all know that Ruapehu has the elevation, so temperature is less of an issue. My estimates suggest this sort of year is worth another 8 per cent on average, again with five out of seven such wrong’un El Nino years recording above average falls.
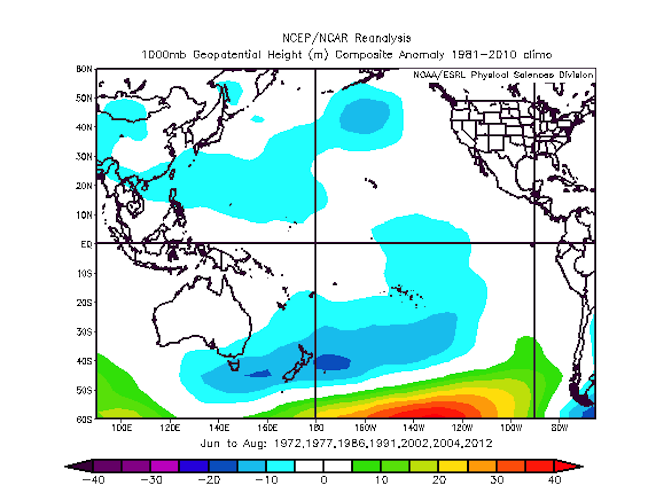
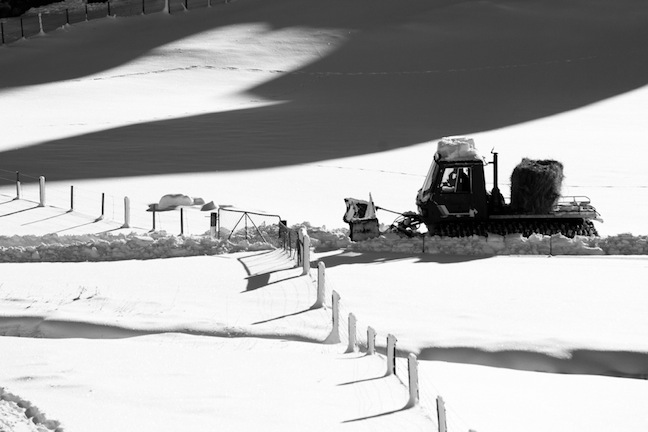
These are the El Nino’s you don’t mind taking home to dad.
Buttered side up?
So what’s it going to be? The classic El Nino that will reduce snowfall. Or a wrong’un El Nino that spins the other way and turns everything it touches to snow? Just as I said in my Australian Snow Outlook, it’s too close to call right now. Some of the climate models are pointing in one direction, some in the other. My job over the next few months is going to be to search for any clues as to which way this could fall.
Until then, I’m going to lean slightly towards the wrong’un flavour and call a solid year for the North Island and Canterbury fields, and an average year for the Southern Lakes. I’ll need to back track on that if the more classic variety of El Nino becomes more likely, but until then let’s be optimistic.
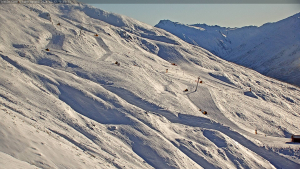
Lots of lows crossing central NZ doesn’t hurt
Having said that, I’ll repeat the warning I give every year for NZ. If you book in June and don’t leave time for things to build, then you’re taking a risk that a slow start to the season could upset your plans. Book in August or September and your chances for a decent base improve, but you’ll deal with bigger crowds. The choice is yours.
Would I buy a season pass on this information? If I knew I could get the time off work, then yes.
That will do for now. We’ll update this outlook in late-May as the excitement starts to build. If you’ve got a different theory on what’s going to happen this winter, or just want to provide feedback, then please hit me up at grasshoppermw@gmail.com or join the Facebook discussion below.
The Remarkables forecasts,
snow reports and
live snow cams.
Treble Cone forecasts,
snow reports and
live snow cams.
Snow Park forecasts,
snow reports and
live snow cams.
Cardrona forecasts,
snow reports and
live snow cams.
Turoa forecasts,
snow reports and
live snow cams.
Coronet Peak forecasts,
snow reports and
live snow cams.
Whakapapa forecasts,
snow reports and
live snow cams.
Mount Hutt forecasts,
snow reports and
live snow cams.