SNOW SEASON OUTLOOK WESTERN US & CANADA – The La Nina Flavour
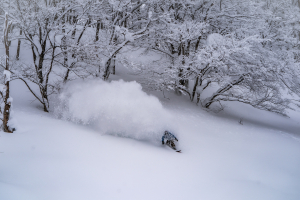
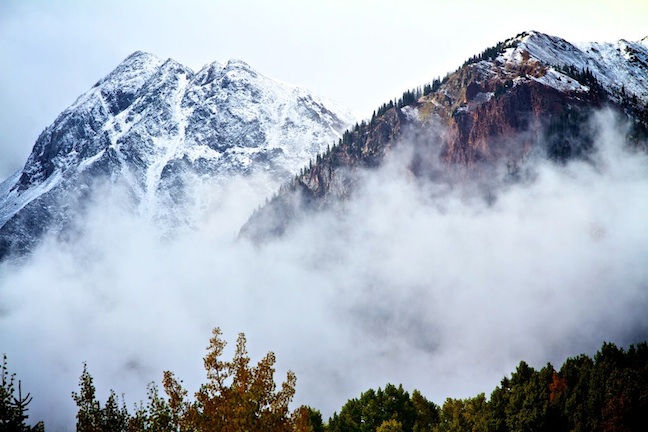
In a record breaking season, California’s Mammoth Mountain practically drowned in powder, 26 February 2011. Image:: Mammoth
Snow Season Outlooks | The Grasshopper
Here we go with another seasonal outlook and today we’re going to look at the western United States and Canada. Last season we separated these outlooks, but the climate pattern we’re expecting this year means we can lump them in together.
The theme of the outlook is going to be mixed messages. We’ll start by talking about the rather large disagreement among various climate models about what the El Nino Southern Oscillation is going to do this northern hemisphere winter. Then we’ll look at how precipitation and temperature is likely to vary across our outlook area, depending on exactly how things play out.
She’s baa-ack
You’ve no doubt heard that we’re expecting another La Nina this northern winter, hot on the heels of last year’s strong La Nina, which coincided with a fantastic year for snow lovers from Canada to north-west Colorado, not to mention northern California.
As far as I know, in September this year it was NOAA’s Climate Prediction Centre in the US that was the first major forecasting bureau to announce a La Nina event had started, mostly due to the fact that they apply slightly looser criteria than other agencies.
The centre has also been the most confident about the fact we’re slipping back into a full season of La Nina, spurred on by their climate model which is predicting strong cooling off the eastern Pacific in the next few months.
But other climate models, from the world’s other leading meteorological agencies, haven’t been so confident about the strength of this La Nina. So while we’re pretty sure we’re expecting things to have a La Nina flavour this year, we don’t really know if we’re going to get a weak, moderate, or strong event. And as I’m going to show you now, that matters. A lot.
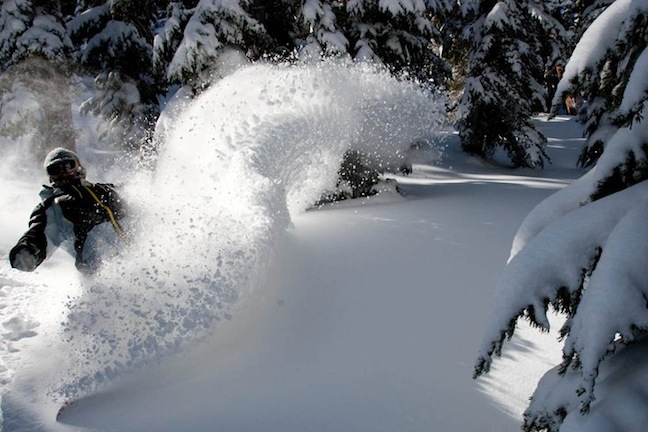
First snow for Aspen, 15 September 2011. Image:: Aspen/Dave Amirault
What’s your flavour?
The next three charts plot how much below or above average November to March precipitation (rain, hail, snow) has been for a selection of weak, moderate and strong La Nina events. You will see that there are major differences between the different flavours of La Nina, with five weak La Nina’s shown in Figure 1 actually resulting in less rainfall than normal across a wide area. The reduction was strongest on the coast around Vancouver and also on the border of California and Oregon, where on average they get about 150mm less rain during weak La Nina.
On the other hand, during five moderate La Nina’s shown in Figure 2 the Pacific Northwest gets hammered with up to 250mm extra during a moderate La Nina, and this signal spread down into northern California during strong La Ninas depicted in Figure 3. You can see the signal gets weaker the further south and east you go, and eventually flips to negative rainfall anomalies over the south-west United States.
Incidentally, this pattern encourages cattle farmers in the south-west to sell down their stock to guard against not having enough feed if a drought eventuates and the extra supply depresses beef prices in New Zealand and Australia. But anyway, this article is about snow, and the Grasshopper is vegetarian, so back to the weather.
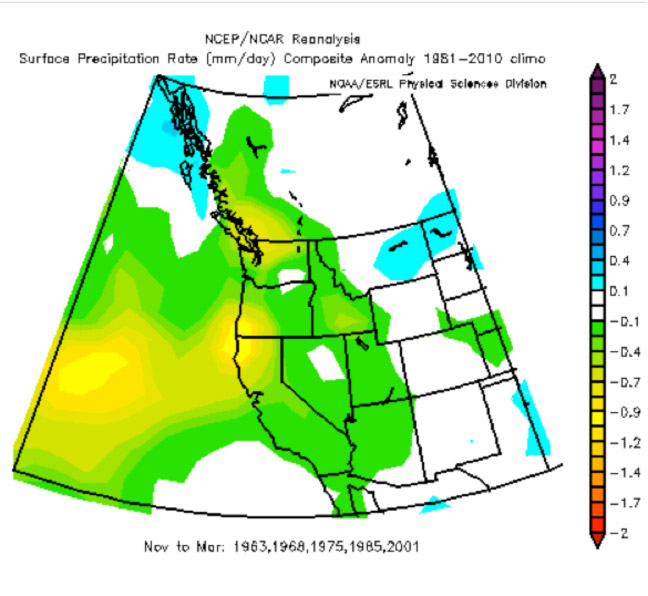
Figure 1: Precipitation anomalies during five weak La Nina years
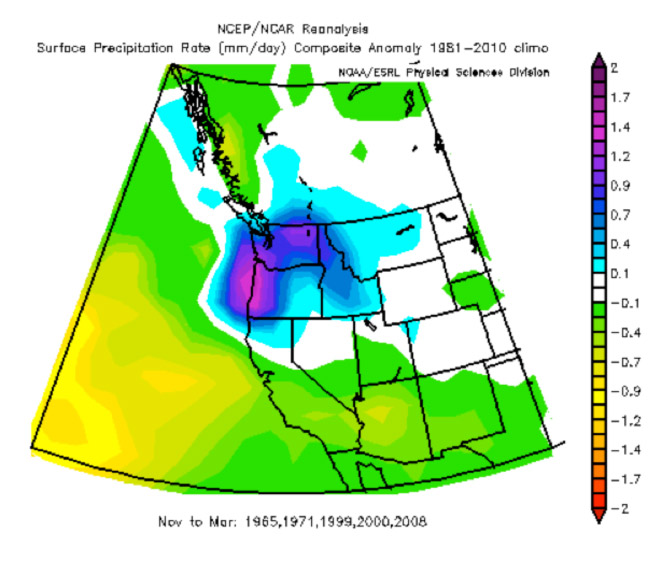
Figure 2: Precipitation anomalies during five moderate La Nina years
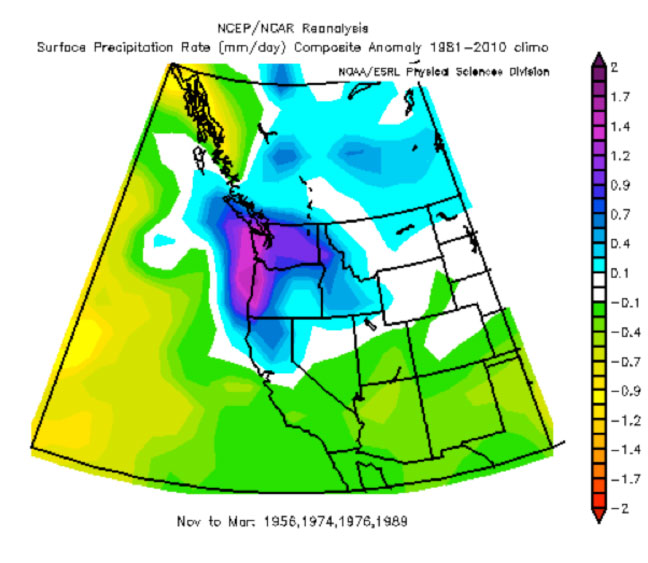
Figure 3: Precipitation anomalies during four strong La Nina years
Cool change
Obviously for snow we also want surface temperatures to be below zero degrees Celsius as often as possible from November to March, and the next three charts again paint a picture that not all La Ninas are created equal. In Figure 4 you can see that during the five weak La Ninas selected we had colder than normal conditions across pretty much the entire western US and Canada. During the moderate La Ninas these colder than normal conditions were confined mainly to the coast and northern BC, and then in strong La Ninas the colder temperatures push inland again.
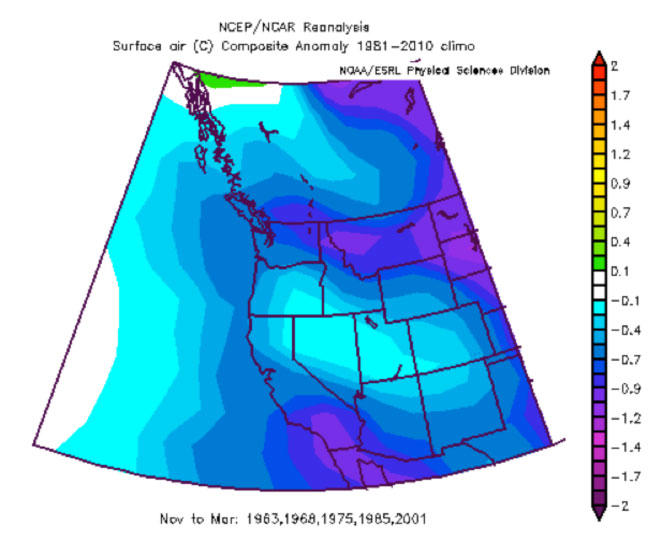
Figure 4: Surface temperature anomalies during five weak La Nina years
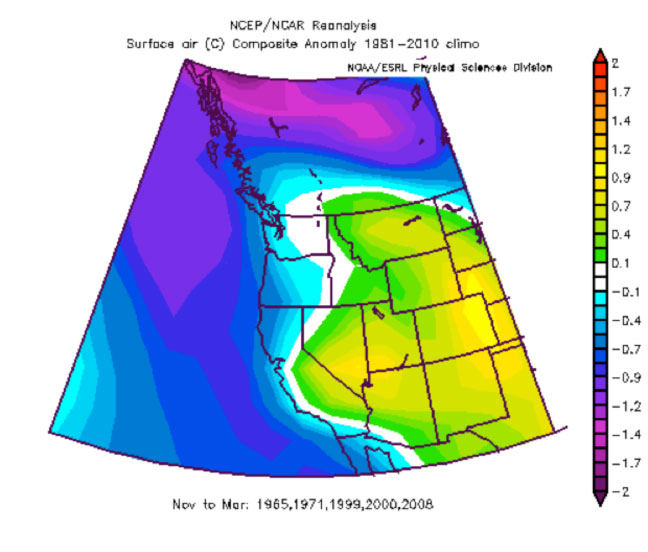
Figure 5: Surface temperature anomalies during five moderate La Nina years
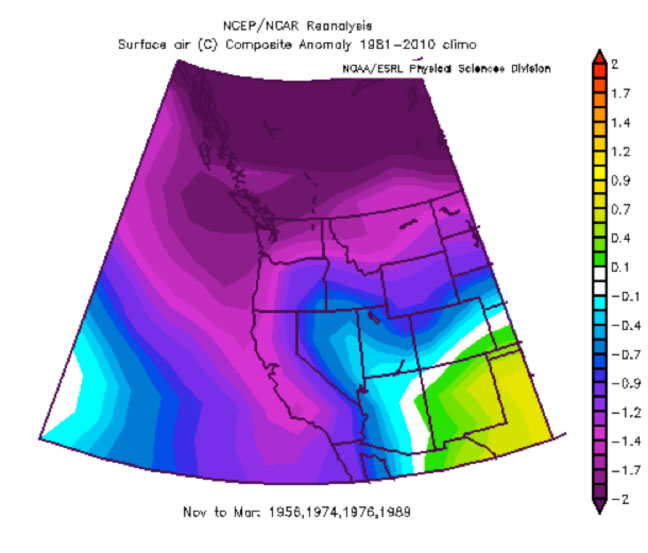
Figure 6: Surface temperature anomalies during four strong La Nina years
Temperature isn’t always going to be a factor, especially during the coldest months, but it is definitely going to play a part at either end of the season, dictating whether we get rain or snow in borderline events, so the way these anomalies change is very interesting.
To have a look at why this might be happening, the next three charts show how much surface pressures were below or above average during these different flavoured La Nina’s, and the results are quite cool.
Under pressure
First, we have to look at what the pressures normally do, shown in Figure 7. There are two quite famous climate actors on show here. The first is the Aleutian Low – the area of lower pressure (blue colours) sitting up near Alaska. This low becomes dominant during winter and it is the place where many cyclonic storm systems intensify before slamming into the North American Coast.
The other thing you can see is the North Pacific High – the area of orange colours between Hawaii and California. There’s also a semi-permanent high over the North American continent, caused by the air near the earth’s surface becoming very cold and dense during winter.
The pressure decreases steeply between the Pacific High and the Aleutian Low and this results in a mean south-westerly wind as the air tries to flow from high to low pressure, but is turned to the right by the earth’s rotation.
Remember that this is only an average pressure. In reality, the weather patterns are changing all the time. But in general, the storms that interest us come in on some sort of westerly flow, and it is the short-term variations in the pressure field that dictate where these features travel and the distribution of the snow they deliver. But the difference in that average pressure field during La Nina years will give us some indication of changes in the average path and intensity of storms.
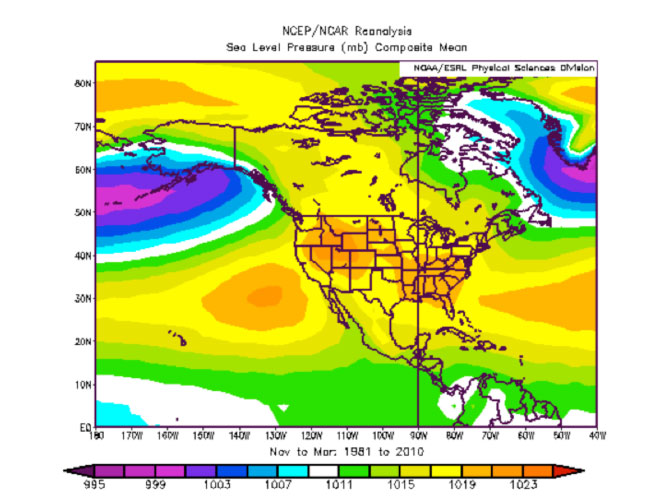
Figure 7: Composite Mean Sea Level Pressure from November to March
So to start with, Figure 8 shows that during strong La Ninas the Aleutian low is not quite as deep (the anomaly is positive) and lower pressures are more likely over the interior of North America (the anomaly is negative), and this is essentially going to mean a higher frequency of strong, cold north-westerly outbreaks and greater penetration of storms across the Pacific north-west, across Idaho and spreading east towards the western Great Lakes and south-east towards north-west Colorado.
Another way to understand this is that the North Pacific High we saw earlier is more likely to extend a ridge northwards that disrupts the usual westerly jet-stream across the north pacific. The jet stream, which steers the storms, has to go around this ridge, and attack from the north-west more often, rather than from the south-west. During moderate La Ninas, shown in Figure 9, we have a fairly similar situation, but it’s just not as strong.
However, during weak La Ninas, as in Figure 10, we can note two things. First, the positive pressure anomaly is much weaker, and it’s now extending over the continent. Second the low pressure anomaly is now confined to largely south of Montana. So instead of having a north-westerly wind anomaly, we’ve now got a northerly or north-easterly anomaly (follow the contours clockwise around the positive anomaly). This makes a huge difference because it is going to mean a greater frequency of cold, dry winds off the continent, rather than cold moist winds off the ocean. We still get the strong westerlies during those weak La Nina winters, but we get less of them, and I think that’s the crux of why those weak La Nina years aren’t such good news for snow lovers in the western US and Canada, even though they do bring lower temperatures.
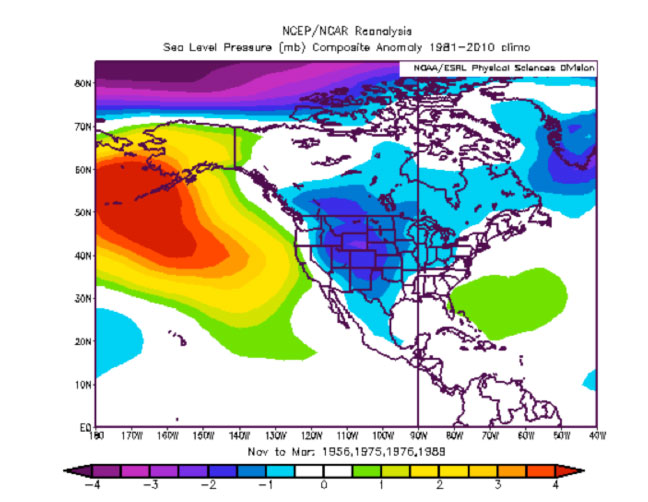
Figure 8: Sea level pressure anomalies from November to March during four strong La Nina years
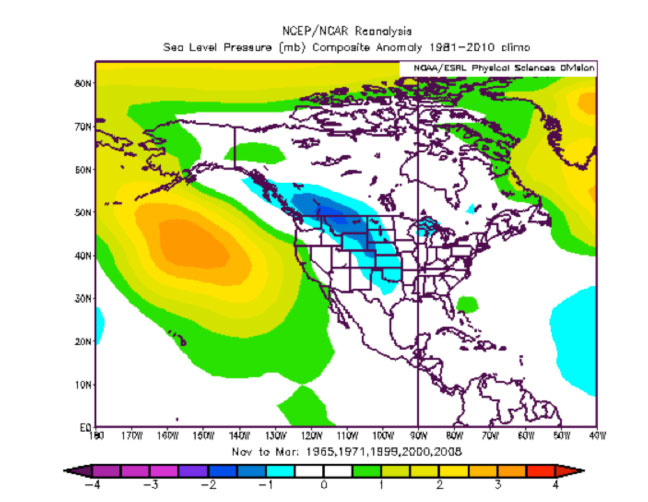
Figure 9: Sea level pressure anomalies from November to March during five moderate La Nina years
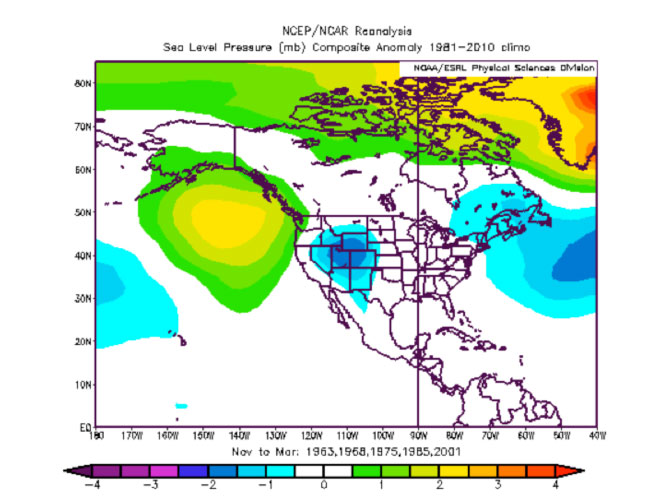
Figure 10: Sea level pressure anomalies from November to March during five weak La Nina years
Time for my money to follow my mouth
So we’ve seen that there’s uncertainty over the flavour of the La Nina event we can expect this winter. And we’ve seen that the flavour of the event is very important to seasonal forecast of snow over the western US and Canada. But it’s time to make a call, and I’m going to go for a very moderate La Nina, that I think will have the following impacts on snowfall:
| Location | Expected snowfall variation this season |
| Canadian Coastal Mountains (incl Whistler) | Zero to 10 percent above average. |
| Canadian Rockies (from Kamloops and Kelowna through to Banff and Fernie) | Five to 15 per cent above average |
| North-western US (Washington, Oregon, Idaho, western parts of Wyoming and Montana) | Ten to 20 per cent above average (extra precipitation, but also colder temperatures tilting the rain/snow balance) |
| Sierra Nevadas | Zero to 10 per cent above average (not so much on account of more precipitation, but rather colder temperatures tilting the rain/snow balance during a couple of big events) |
| Utah and North-west Colorado | Zero to 10 per cent above average (Although the snowfall here should never be described as average) |
| South-west Colorado | Zero to 10 per cent below average |
Now I’ve stuck my finger on a fairly tight range of expected snowfall in the table above. But we all know that indicators like La Nina are easily swamped by climate “noise”. That is, one big random storm, that “just happens”, could change the winter from mediocre to spectacular, and blow my predictions out the window.
There’s big variation from year to year, even during years with a similar flavour, so when you write seasonal outlooks you aim for mostly right, not always right. At the end of this winter, if I’ve at least got the direction right on four of the six areas I identified, then I’ll consider that a pretty successful forecast.
In terms of the timing of the season, this La Nina is getting up to strength so late in the year that I’d expect a fairly normal start. But those places that get extra snow, and also have that colder weather we talked about above, may just squeeze another couple of weeks out of the end of winter.
That’s all from the Grasshopper. Got a question or feedback for me? Think I’ve missed something? Hit me up at grasshoppermw@gmail.com, twitter, or facebook
Remember that from November you can catch my thrice-weekly snow forecasts for key resort areas in Japan, Canada and the US.
And you can check out my snow season outlook for Japan here
Lake Louise forecasts,
snow reports and
live snow cams.
Heavenly forecasts,
snow reports and
live snow cams.
Big White forecasts,
snow reports and
live snow cams.
Whistler forecasts,
snow reports and
live snow cams.
Vail forecasts,
snow reports and
live snow cams.
Steamboat forecasts,
snow reports and
live snow cams.
Snowbird forecasts,
snow reports and
live snow cams.
Aspen Mountain forecasts,
snow reports and
live snow cams.
Sun Peaks forecasts,
snow reports and
live snow cams.
Park City forecasts,
snow reports and
live snow cams.
Breckenridge forecasts,
snow reports and
live snow cams.
Silver Star forecasts,
snow reports and
live snow cams.
Mammoth forecasts,
snow reports and
live snow cams.